causality
The paradox in the admissions data
It is 1973 at Berkeley, and the graduate admissions numbers look like a lawsuit: campus-wide, men are admitted at a markedly higher rate than women. But department by department, the effect shrinks, vanishes — in places reverses, with women admitted at higher rates. Both tables are arithmetically correct. Resolve it: show how aggregation reverses an association when a lurking variable — here, which departments women apply to, and how selective those departments are — correlates with both group and outcome. Then answer the question the university actually faces: which table speaks to discrimination, and what causal assumption licenses the choice? Get it wrong in either direction and you certify bias that is not there, or explain away bias that is.
Who this problem belongs to
The two figures whose methods fit it best, out of 60 in contention.

Bickel is not analogous to this problem, he is one of its actual authors. His 1975 Science paper with Eugene Hammel and J. William O'Connell, Sex Bias in Graduate Admissions: Data from Berkeley, is the definitive statistical analysis of exactly this dataset, showing that the campus-wide gender gap in admission rates reversed or vanished within most individual departments because women disproportionately applied to more selective departments, a lurking variable correlated with both gender and admission outcome. His careful department-by-department decomposition, distinguishing an aggregation artifact from genuine departmental bias, is precisely the resolution the problem asks for, and his broader career in semiparametric and robust estimation gave him the statistical tools to make that decomposition rigorous rather than merely descriptive. This is the single most direct historical match possible in the entire roster.
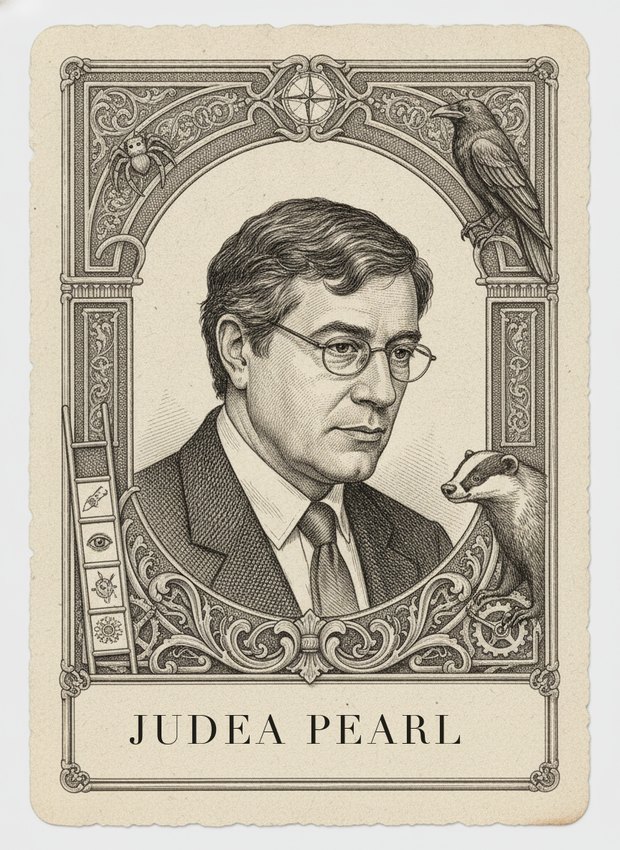
Pearl's causal framework, developed from the mid-1980s onward through Bayesian networks and later formalized as do-calculus, gives the rigorous machinery for answering the problem's hardest question: which table, aggregate or department-level, actually speaks to discrimination, a question that cannot be resolved by staring at conditional probabilities alone but requires an explicit causal model of how department choice, gender, and admission decisions relate. His treatment of Simpson's paradox specifically became a canonical textbook example in his own writing, using causal diagrams to show that the correct answer depends entirely on whether the lurking variable is a confounder to control for or a mediator to leave alone. His methods postdate the actual 1973 event by over a decade, so while he supplies the sharpest possible resolution, he did not perform the original analysis.
In the mind map
The same ideas, as concepts rather than history — in John's ML knowledge map.
60 figures are scored on this problem. Draw it in a battle to see where you land.