regression
Why tall fathers have shorter sons
It is the 1890s in London, and a puzzle in the heredity data refuses to sit still: exceptionally tall fathers tend to have sons who are tall but, on average, less extreme than themselves — a pull back toward the mean that looks like a force but is only a property of imperfect correlation. Formalize it: fit the line relating sons' heights to fathers', interpret its slope as the regression coefficient, and explain precisely why "regression toward mediocrity" is a statistical artifact, not biology fighting back. Get it wrong and you read the mean-reversion as a real hereditary tendency — a confusion that, uncaught, corrupts a century of claims about talent, treatment, and improvement wherever measurements are repeated.
Who this problem belongs to
The two figures whose methods fit it best, out of 62 in contention.
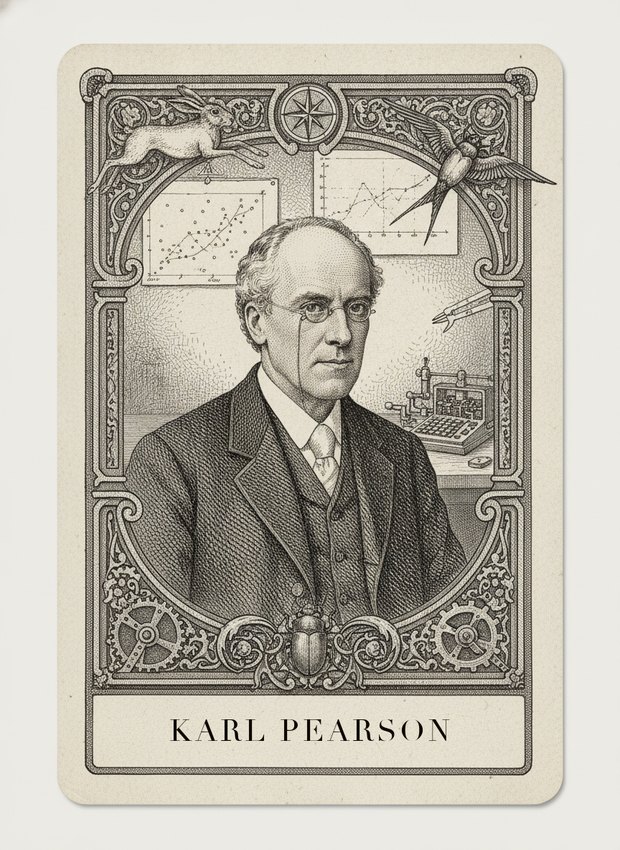
This is Pearson's own discovery, made in direct collaboration with Francis Galton on precisely this heredity data. Pearson formalized the correlation coefficient in his 1896 paper 'Mathematical Contributions to the Theory of Evolution,' building rigorously on Galton's 1886 observation that tall fathers' sons regress toward the population mean, and Pearson supplied the exact mathematical machinery — the correlation coefficient and the regression line's slope as a function of that correlation — that proves the effect is a property of imperfect correlation between two variables, not a biological force pulling extremes back. He founded Biometrika specifically to house this research program. Working in 1890s London on this exact dataset with Galton, Pearson is not applying an outside toolkit to this problem; he is the person who built the toolkit for this problem.

Gauss's method of least squares, developed around 1809 for fitting astronomical orbits to noisy observations, is the mathematical machinery underlying the regression line itself — without a principled way to fit a line minimizing squared error, there is no slope to interpret as a regression coefficient in the first place. His work on the normal distribution also underlies the assumption that height measurements scatter around a mean in the bell-curve shape Galton and Pearson relied upon. But Gauss died in 1855, three decades before Galton's heredity work, and never applied his fitting procedure to biological inheritance or considered the specific 'regression toward mediocrity' phenomenon; he supplies the essential mathematical tool without engaging this problem's substantive biological puzzle.
Fought here
In the mind map
The same ideas, as concepts rather than history — in John's ML knowledge map.
62 figures are scored on this problem. Draw it in a battle to see where you land.